Look, we've all watched this movie before. The market climbs steadily upward, investors get comfortable, and then—bam!—the floor drops out from under everyone.
I've been tracking S&P performance patterns since the late 90s, and something about today's market structure has me reaching for the antacids more frequently than usual.
Between 2000 (post-tech bubble) and 2008's pre-crisis peak, the S&P delivered a staggering 18% annual return including dividends. Not too shabby! Then came the financial crisis, wiping out half the market's value and countless retirement dreams along with it.
What's happened since then? From 2009 through today, we've seen 15% annual growth. Technically underperforming the previous cycle by 3 percentage points, but—and this is crucial—lasting twice as long. Sixteen years versus eight. The power of compounding at work.
But here's where things get interesting (and by interesting, I mean potentially terrifying).
The market has a nasty habit of giving back gains faster than your teenager goes through your refrigerator after school. If we lost just the last four years of gains—just four!—the S&P would drop 15%. And that's considered a moderate correction by historical standards.
Worse yet, recovery isn't quick. Looking at the last four major crashes, markets took nearly four years on average to climb back to previous highs. Four. Long. Years.
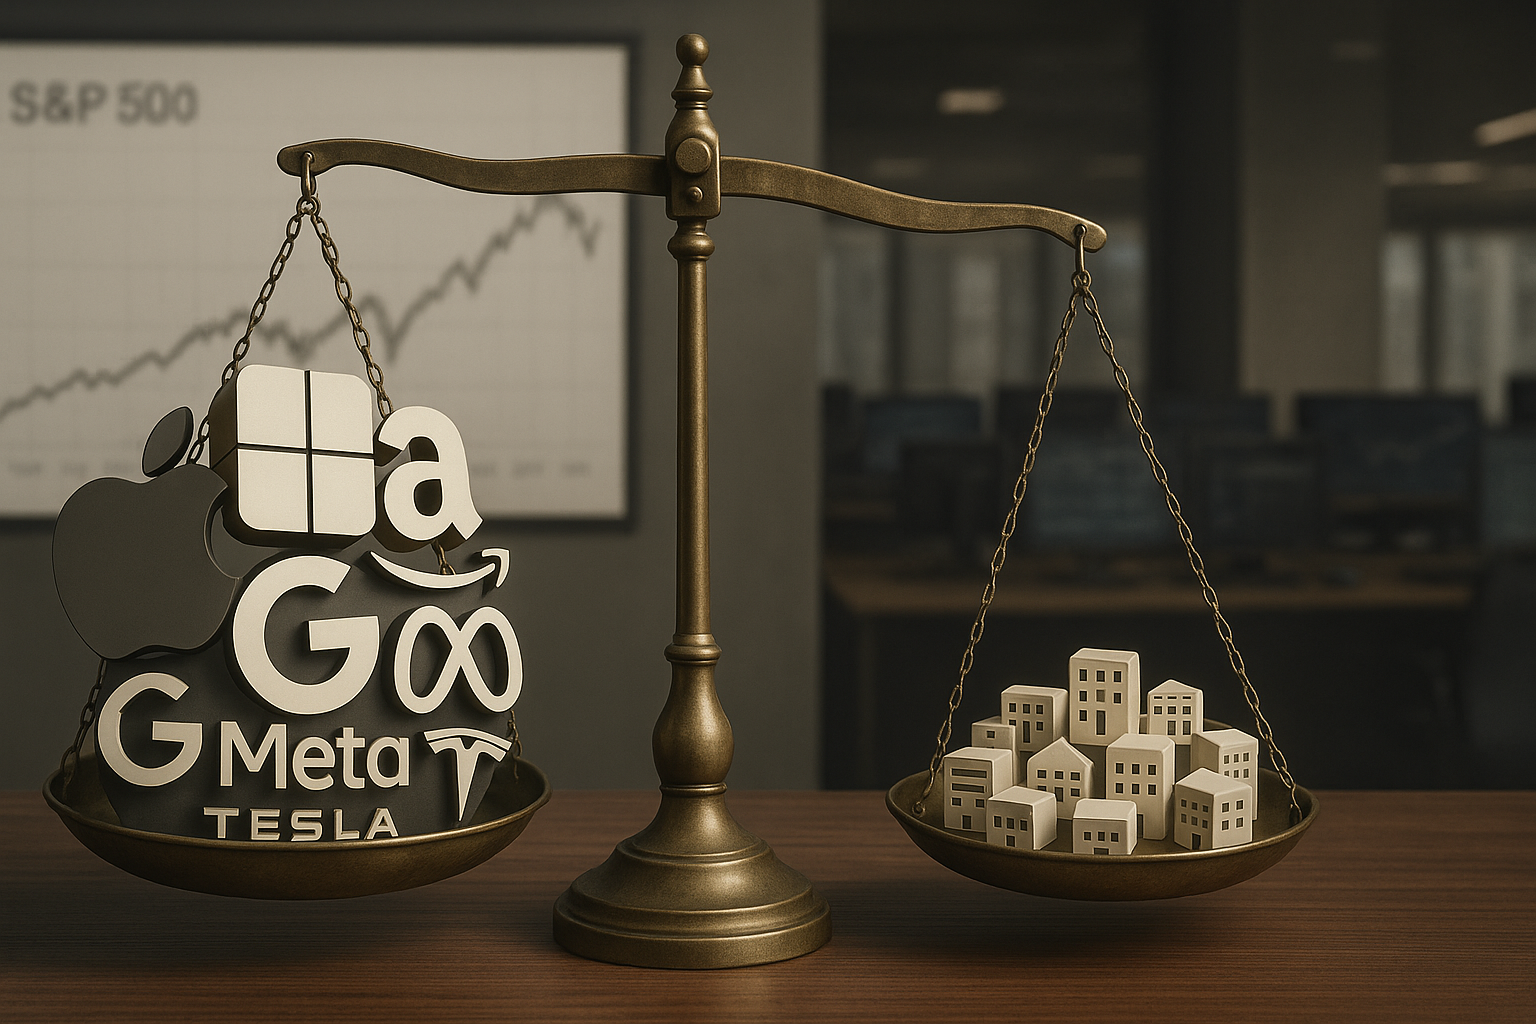
And that brings me to what I believe is the most underappreciated risk in today's market: concentration.
The top 10 U.S. companies (your Nvidias, Microsofts, Apples, and the rest of the tech behemoths) now dominate indexes to an unprecedented degree. If these ten companies dropped 25%—perhaps because investors finally realize that not every company mentioning "AI" deserves a stratospheric multiple—a global index might fall 5%, while the S&P would drop 8%.
That doesn't sound catastrophic until you consider a worse scenario. If these mega-caps fell 50% (which has absolutely happened before), a global tracker might lose 10%, while the S&P could plummet 16%. And that's assuming other stocks wouldn't follow the leaders downward, which is about as likely as finding a Wall Street trader who turns down free money.
I spoke with several wealth managers last week who are quietly shifting client allocations in response to these concentration risks.
"We're not bearish on tech fundamentals," one told me, requesting anonymity because their firm officially remains bullish. "But when ten stocks can move the entire market this dramatically, that's not diversification—that's a tech fund with 490 side bets."
So what's an investor to do? Two things seem prudent.
First, genuine diversification matters more than ever. A global index tracker provides meaningful protection against U.S. concentration risk. Yeah, international stocks have been the ugly stepchild of investing for years now, but that's precisely why they offer protection. When (not if) U.S. mega-caps stumble, exposure to other markets will soften the blow.
Second, for heaven's sake, plan your liquidity needs! That four-year average recovery time isn't just an interesting statistic—it's a warning. Having four years of expenses in cash or near-cash investments means you won't be forced to sell at the worst possible time.
Having covered market cycles since the dot-com bubble, I've noticed one constant: psychology drives prices short-term, fundamentals win long-term. Today's market psychology has convinced many investors that a handful of tech giants deserve to dominate our indexes.
Maybe they're right. But wouldn't you rather be prepared if they're wrong?
The S&P 500 simply isn't as diversified as its name suggests. When was the last time you checked your 401(k) allocation? It might be worth a look.
Just saying.