The dollar index has been putting on quite a show lately, dancing its way into what technical analysts are now flagging as a potential reversal zone. Based on both Lower Time Frame (LTF) charts and Daily Time Frame Fibonacci extensions, we might be approaching one of those moments where chart patterns and market psychology collide in interesting ways.
Look, I've spent enough time on trading floors to know that Fibonacci retracements are either mathematical magic or sophisticated astrology, depending on whom you ask and how their last trade using them turned out. But the clustering of signals on DXY is worth paying attention to, even for the technically skeptical among us.
The thing is, technical analysis works in currency markets partly because enough people believe it works. It's one of those self-fulfilling prophecy mechanisms that makes markets such fascinating psychological experiments masquerading as rational price discovery systems.
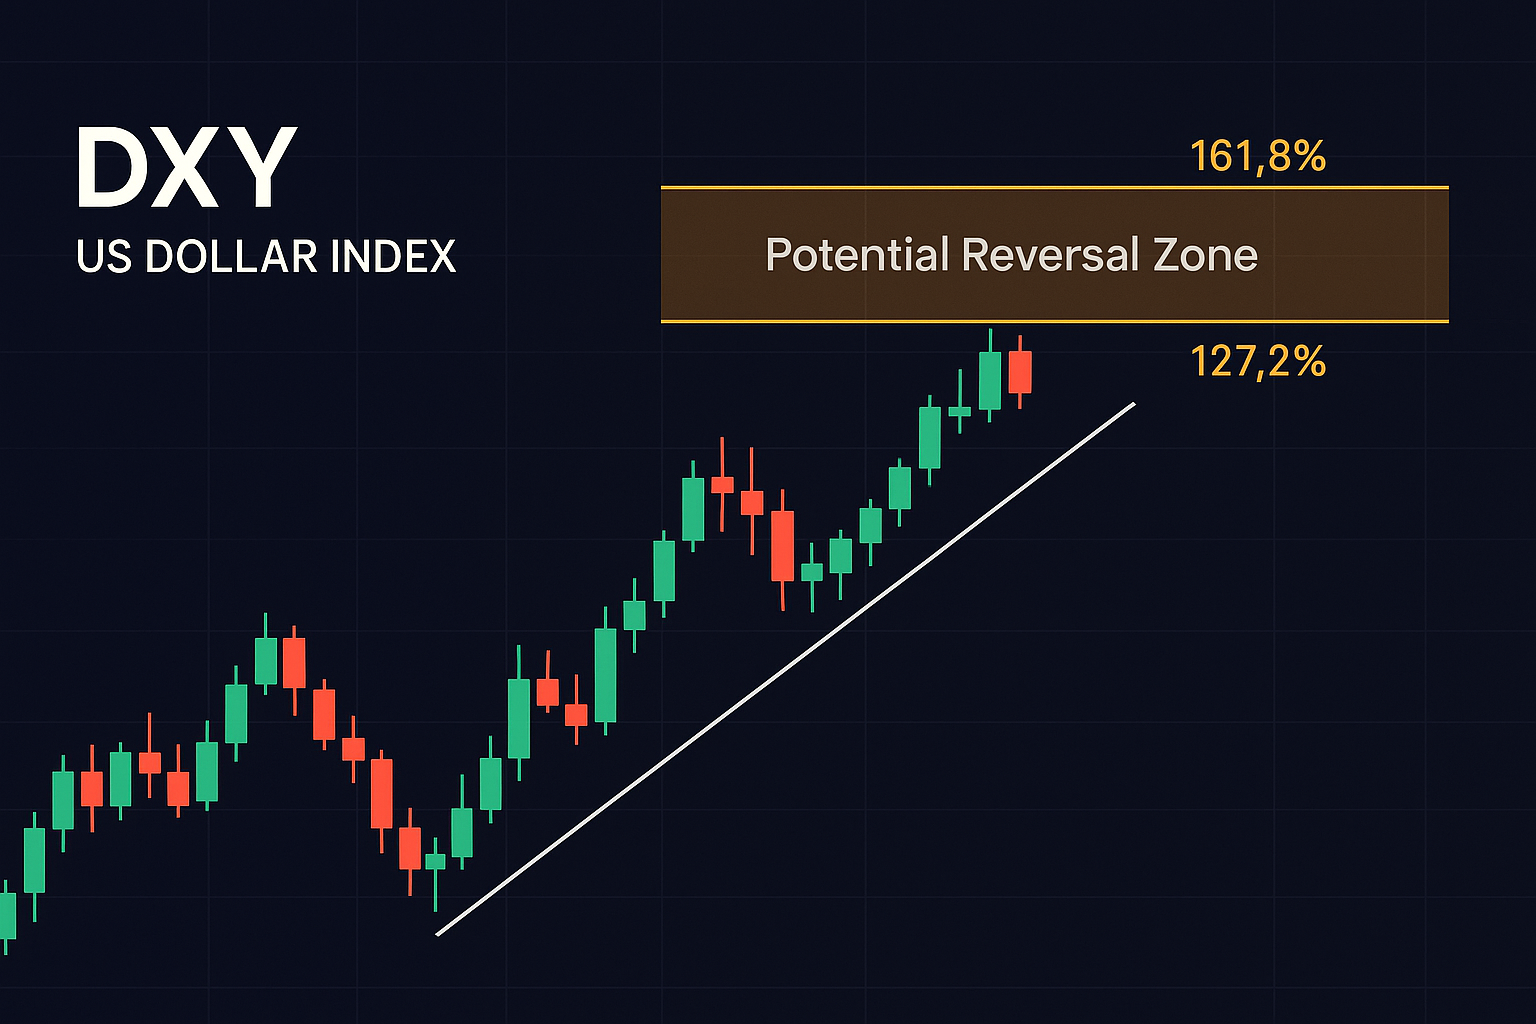
From what I'm seeing, the dollar has been on an extended run that's pushed it into overbought territory by several measures. The daily charts show prices approaching key Fibonacci extension levels – those magical 127.2% and 161.8% numbers that somehow seem to matter more than they mathematically should. Meanwhile, lower timeframe analysis shows momentum indicators rolling over just as prices test these technical barriers.
But technical signals never exist in a vacuum. The potential reversal zone coincides with a market increasingly saturated with dollar bullishness. Positioning data shows specs are about as long the dollar as they've been in recent memory. Remember the old trading floor wisdom: when everyone's on the same side of the boat, it's usually time to check where your life jacket is.
The fundamental picture is where things get complicated. The market has been gradually scaling back expectations for Fed cuts this year – a dollar positive. But at some point, even good news becomes fully priced in. We may be approaching that point of diminishing returns for dollar bulls.
I mean, Treasury yields have been drifting higher for weeks now, supporting the greenback. But watch for any signs of yields stabilizing or retreating – that could be the catalyst that turns these technical reversal signals from theoretical to actionable.
What makes this particular potential reversal fascinating is its timing within the broader economic narrative. We're at that peculiar juncture where markets are trying to reconcile strong headline economic data with underlying vulnerabilities. The dollar often acts as the release valve for these tensions.
There's a model that I often use when thinking about currency reversals: they tend to happen not when new information enters the market, but when the market's interpretation of existing information begins to shift. We might be approaching exactly that kind of inflection point.
For traders watching this setup, the key will be confirmation. Potential reversal zones identified by Fibonacci extensions are just that – potential. They need price action confirmation before becoming actionable. Watch for rejection candles, momentum divergences, or key support breaks on those lower timeframes before committing.
Anyway, I've seen enough of these technical setups to know they're less about precision and more about identifying zones where probability distributions change. The DXY potential reversal zone isn't a guarantee – it's a heads-up that the risk/reward calculation might be shifting.
If this technical view plays out, we could see ripple effects across asset classes. Gold bugs will be watching closely, as would emerging market investors who've been feeling the squeeze from dollar strength.
Or maybe nothing happens at all. Markets have a wonderful way of making mockery of our most elegant analyses. That's what keeps us coming back to this strange game where being right about the what but wrong about the when is just as useless as being wrong about everything.
As always, the market will do what the market will do. Our job isn't to predict but to recognize when conditions are changing and adapt accordingly. This DXY potential reversal zone is just one more piece in that endless puzzle.